This WooCommerce performance case study puts an Australian souvenir store from Down Under in the spotlight. Like them, you may be skeptical about the costs of WooCommerce speed optimization. We get it, it can be a large investment for unknown results and profit return. We will show you that you absolutely cannot afford to not speed up your site if you want to increase customer happiness, conversion rate, revenue along with employee productivity and satisfaction.
We love data here at WP Bullet, it’s the secret to our customer’s success (but shh…), so we thought we would show the true value of performance optimization for WooCommerce stores for small and medium-sized businesses.
Spoiler alert – when you approach performance optimization from the ground up like we do at WP Bullet for our awesome clients, the results will blow your mind and wallet!
Update June 13, 2020: we now have data from the last 3 years showing a 7 figure increase in revenue if optimizations had never been completed, read all the way through for the details :).
WooCommerce Performance Problems
We always run some basic performance tests before optimizing your site. This helps us find the most important optimizations for your site to get you the highest value performance changes as our top priority for your store.
This particular site had a 7 second TTFB which is about 7-10x higher than you want it to be if you are selling physical or digital products. TTFB is directly related to that feeling of snappiness that you get when browsing around a site so it is absolutely critical to conversion rate and revenue.
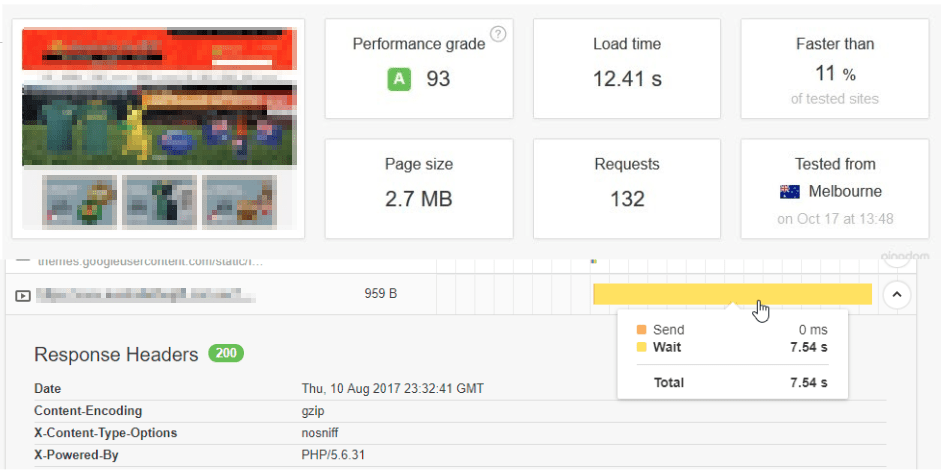
People have to be really desperate to buy from your store if it takes 7 seconds to load. Like really, really desperate, you have to be selling incredibly rare and valuable things to expect a human being to wait 7 seconds to give you money online in the year 2020. Conversion rate was about 0.8% before we got started because plenty of users were getting impatient and leaving due to the extreme slowness. You can also imagine how many abandoned carts there were.
Some people think performance optimization is expensive. What is really expensive is your slow store. In addition to having an unimpressive conversion rate and a high bounce rate, painfully slow stores like this also hamper employee productivity.
Employees who had the unlucky job of managing these orders in the backend wp-admin area were really suffering. All actions in the wp-admin dashboard area were taking 20-30 seconds to complete. It was excruciatingly slow to work on for us. We would not wish that kind of performance pain on anybody so we knew we had to fix these speed issues to restore efficiency for the site’s employees too.
Last but not least, the paid traffic from Facebook and Google ads were going completely to waste. As soon as the ad campaigns were turned on the site would start crashing and showing visitors these errors:
- 502 Bad Gateway
- 503 Backend Fetch failed
- 504 Gateway timeout
All of these errors were indications the site and hosting were in dire straits, if website CPR existed for WooCommerce store, this one needed it, badly!
WooCommerce Optimizations Completed
We won’t bore you with the technical details about what was done to fix this WooCommerce site’s performance issues. The slowest turtle would have beat this site any day of the week if websites could race.
Here is a technical summary of the work that was completed to get the site in respectable speed territory.
- Hosting migration to somewhere cheaper and faster – yes this is possible!
- Server configuration to optimize PHP
- Database configuration to correct inefficiencies and resource allocation
- Troubleshooting via audit to remove problematic theme and plugin code after some thorough forensic analysis
- Theme refactoring
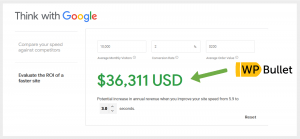
Let’s see what this smorgasbord of WooCommerce speed optimizations resulted in terms of business benefits like Return on Investment (ROI).
WooCommerce Optimization Results
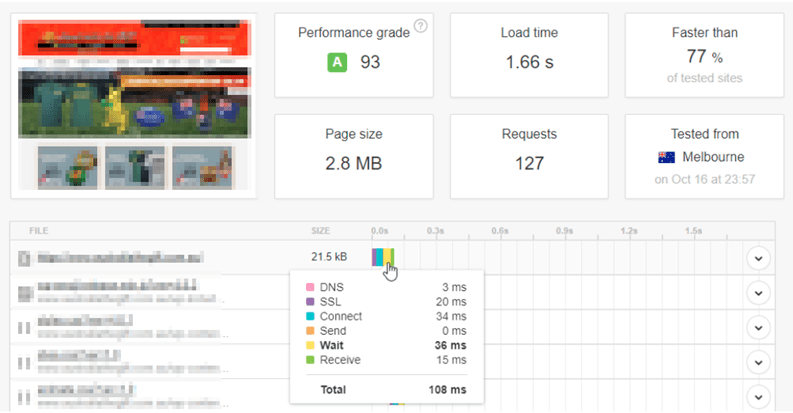
Time to First Byte (TTFB) is closely related to the server response time and is directly responsible for that snappiness feeling you get when browsing a fast site like Amazon.
TTFB is critical to conversion rate and also Google SEO rankings according to research since Google cares so much about user experience.
If you come to WP Bullet for optimiations and your TTFB is 2 seconds or above we will address that first before doing any other optimizations because it is so important for a good user experience.
After our optimizations, we got the TTFB down under 1 second, in fact it was about 100ms according to pindgom.
Let’s see how the TTFB changes affected SEO metrics, conversion rate and revenue.
Google Analytics SEO Improvements
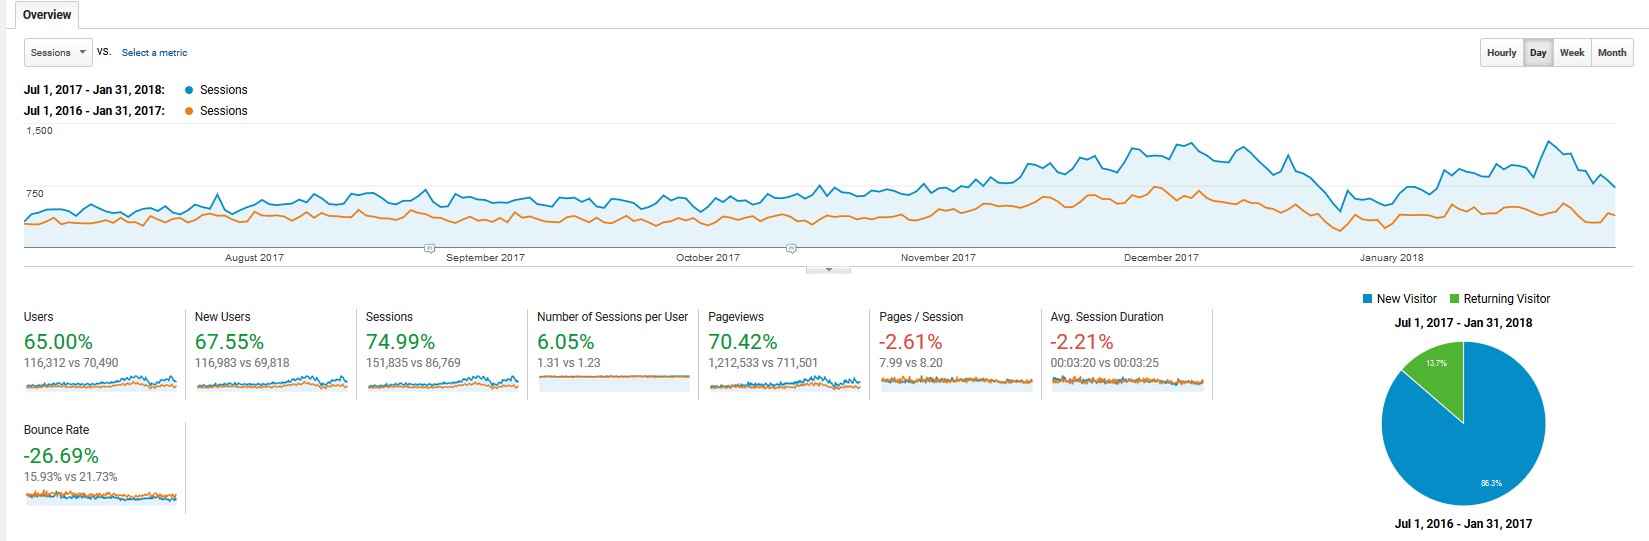
It is very common for SEO to improve after speed optimization for your WooCommerce store. Search rankings (SERPs) go up because your TTFB is lower and visual render time has improved leading to a better user experience (which Google is rewarding and officially announced recently in May 2020). This also leads to a lower bounce rate since people are no longer getting impatient and leaving your store.
According to Google Analytics the number of users went up 65% from 70,490 to 116,312.
The number of New Users (i.e. potential new customers) went up 67% from 69,818 to 116,983.
Overall sessions increased by 74% from 86,769 to 151,835.
Page views increased from 711,501 to 1,312,533.
Bounce rate decreased from 21.73% to 15.93% since people are willing to stay on pages when they do not take 7 seconds to load!
Time for the good stuff like conversion rate and revenue increases.
Conversion Rate and Revenue Increase
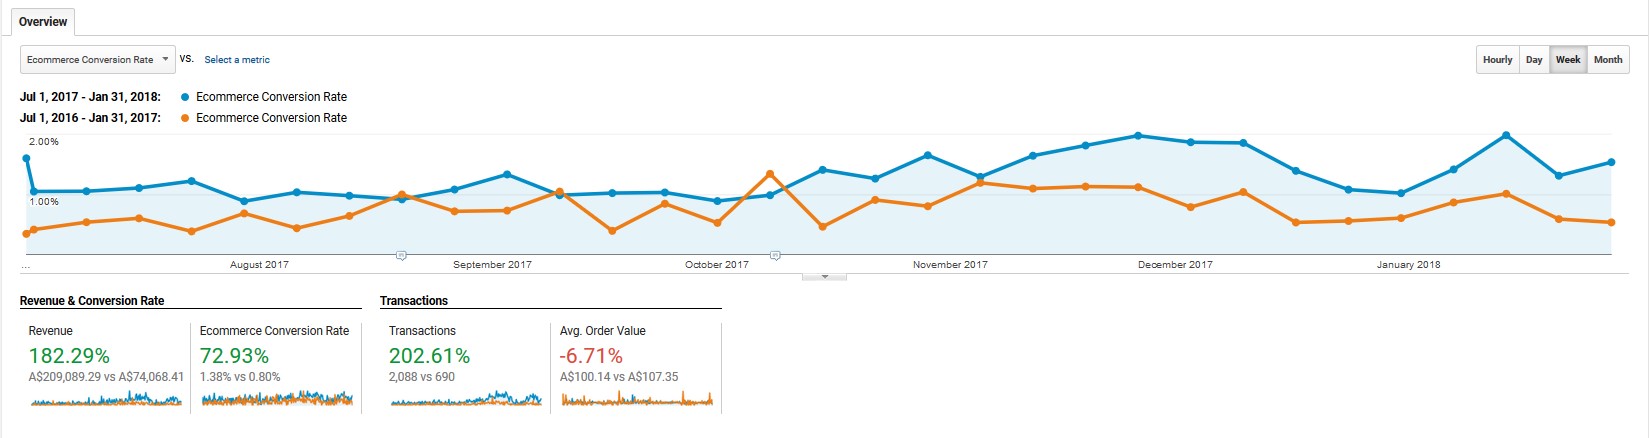
The revenue increased 182% from 74,000 to 209,000 – that is huge – basically tripled!
Here we can see that the conversion rate increased 72.93% going from 0.80% to 1.38% – almost double!
The number of transactions increased from 690 to 2,088 – almost tripled too!
Order value went down but obviously the owners did not care. This was probably due to the users who did actually purchase something prior to optimization buying extra gifts so they did not have to come back and go through the punishment of waiting 7+ seconds for each page load to give this store their hard-earned money.
Normally users will happily come back and order another gift from a gift site but if it moves at the speed of tortoise you probably won’t return! Who wants to be punished with time-wasting for spending money at your store?
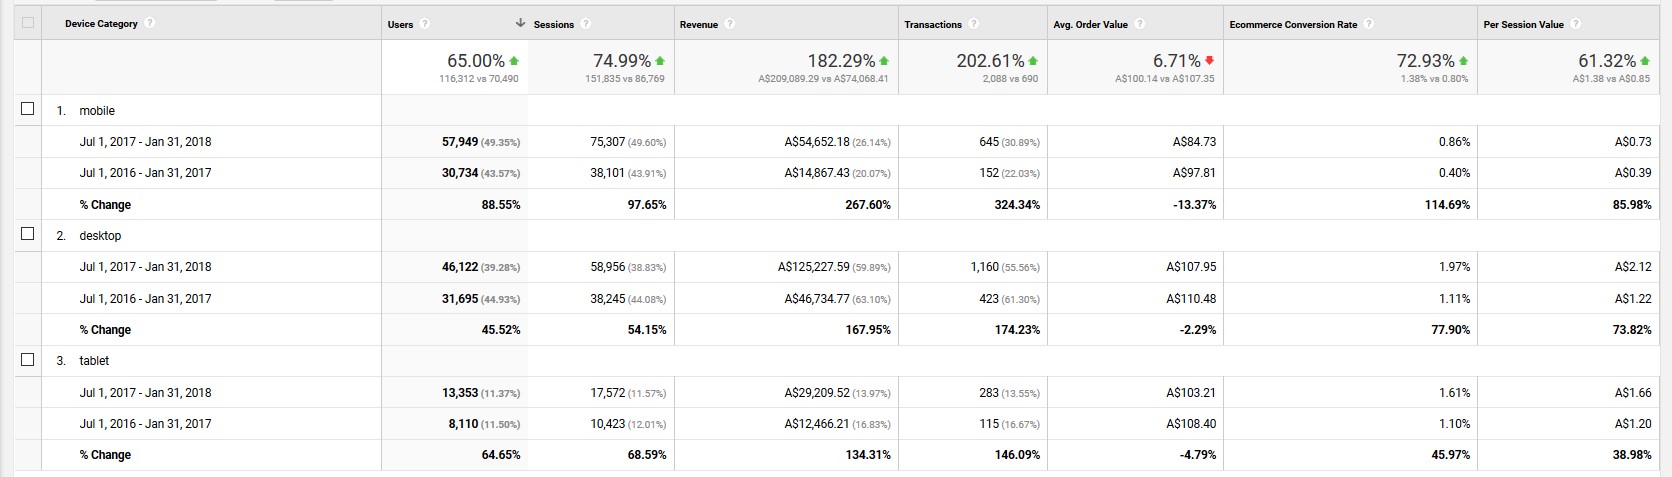
Conversion Rate Increase by Device Type
Here we can see how conversion rate increased by device type. Mobile and tablet usage is on the rise so you are leaving tons of money on the table if your site doesn’t perform well on mobile devices like Apple iPhones and Android-powered units.
The mobile device conversion rate more than doubled from 0.40% to 0.86%.
Increasing the mobile device conversion rate led to a revenue increase from $14,867 to $54,652 – a $40,000 increase and over triple the original!
For tablet users, the conversion rate increased from 1.10% to 1.61% so roughly a 0.50% improvement.
Increasing the tablet conversion rate led to a revenue increase from $12,466 to $29,209 which is over double!
Lastly, desktop user conversion rate increased from 1.11% to 1.97% which is over a 0.80% improvement.
Increasing the desktop user conversion rate led to a revenue increase from $46,734 to $125,227 nearly triple like for mobile users.
Let’s take a look at what this looks like for overall revenue over the 3 month period before and after optimizations.
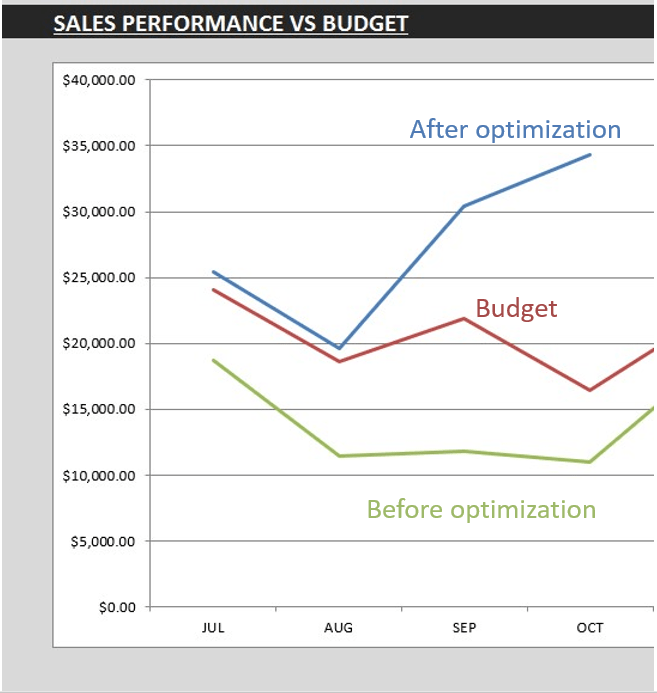
Overall Revenue Increases
This amazing client put together a spreadsheet graphing the revenue increases comparing August-October for 2017 vs 2018.
When he shared this with me he gave me some beautiful quotes.
‘We budgeted 5k sales and around 70 transactions for this week. Looking like we’ll hit 15-16k 160-170 transactions’
There was an $18,000 revenue increase in September 2018 compared to September 2017.
There was a $25,000 revenue increase in October 2018 compared to October 2017.
Based on these numbers, can you really afford not to optimize your WooCommerce store?
I got in touch with the website manager recently in June 2020 and he was kind enough to share some further data, let’s check that out!
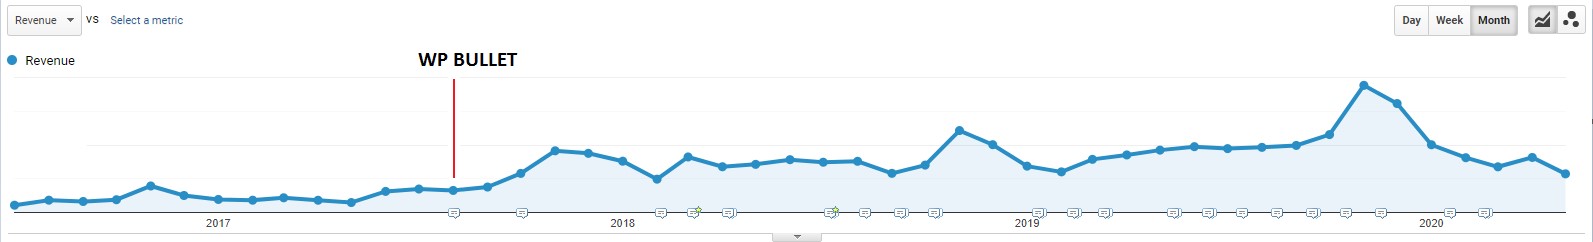
Revenue Changes 3 Years Later after Optimization
We wanted to show how these performance benefits are long term and always worth the investment.
Here is the Google Analytics screenshot showing how revenue stayed high over the years and not just the 3 months after optimization.
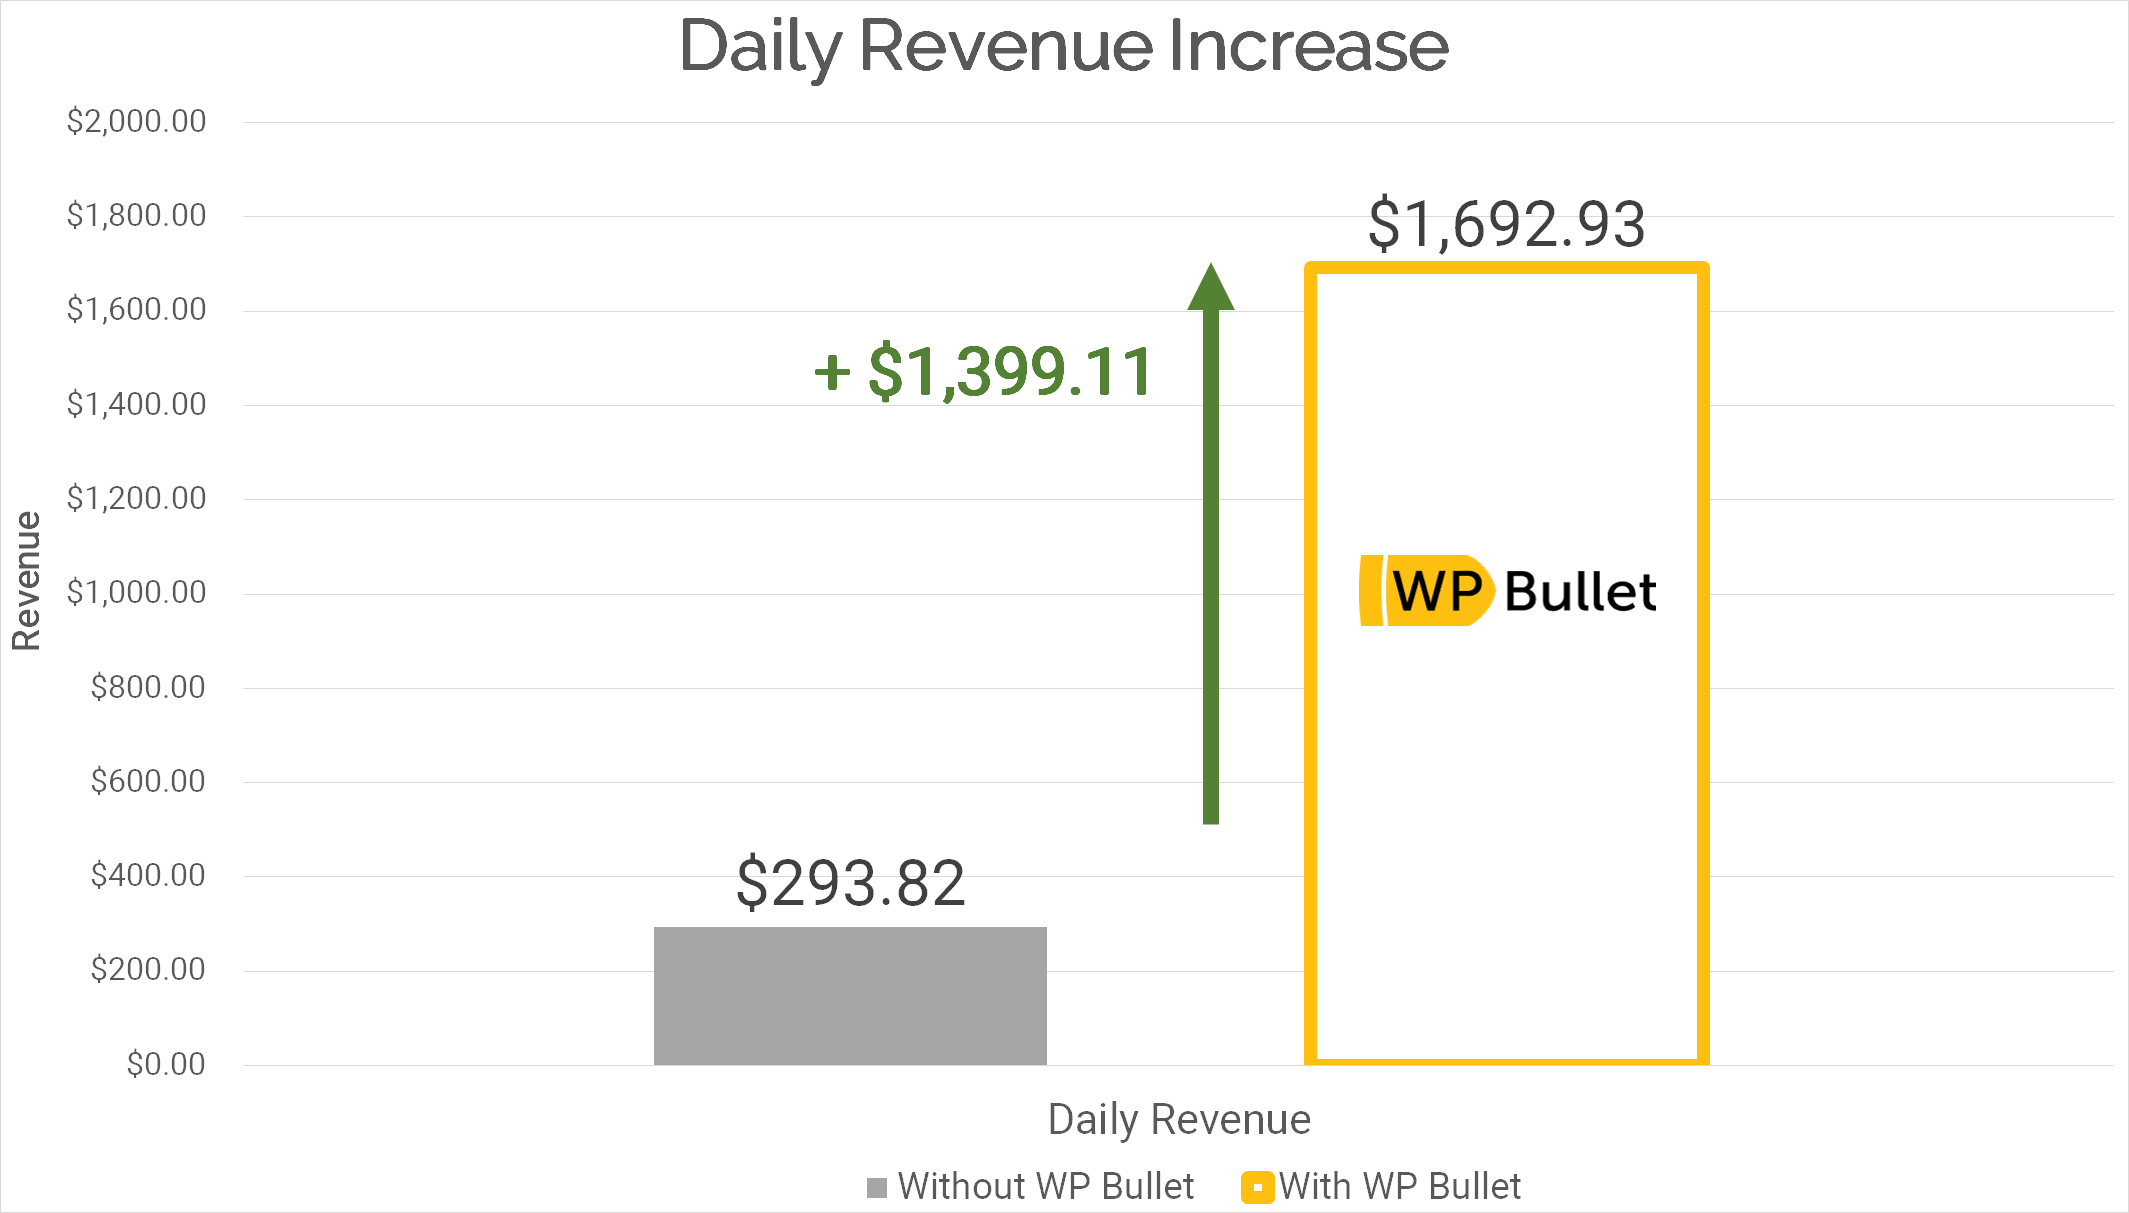
The average daily revenue increased from $293 to $1692 which means a 476% increase.
That is $1,399 extra revenue per day!
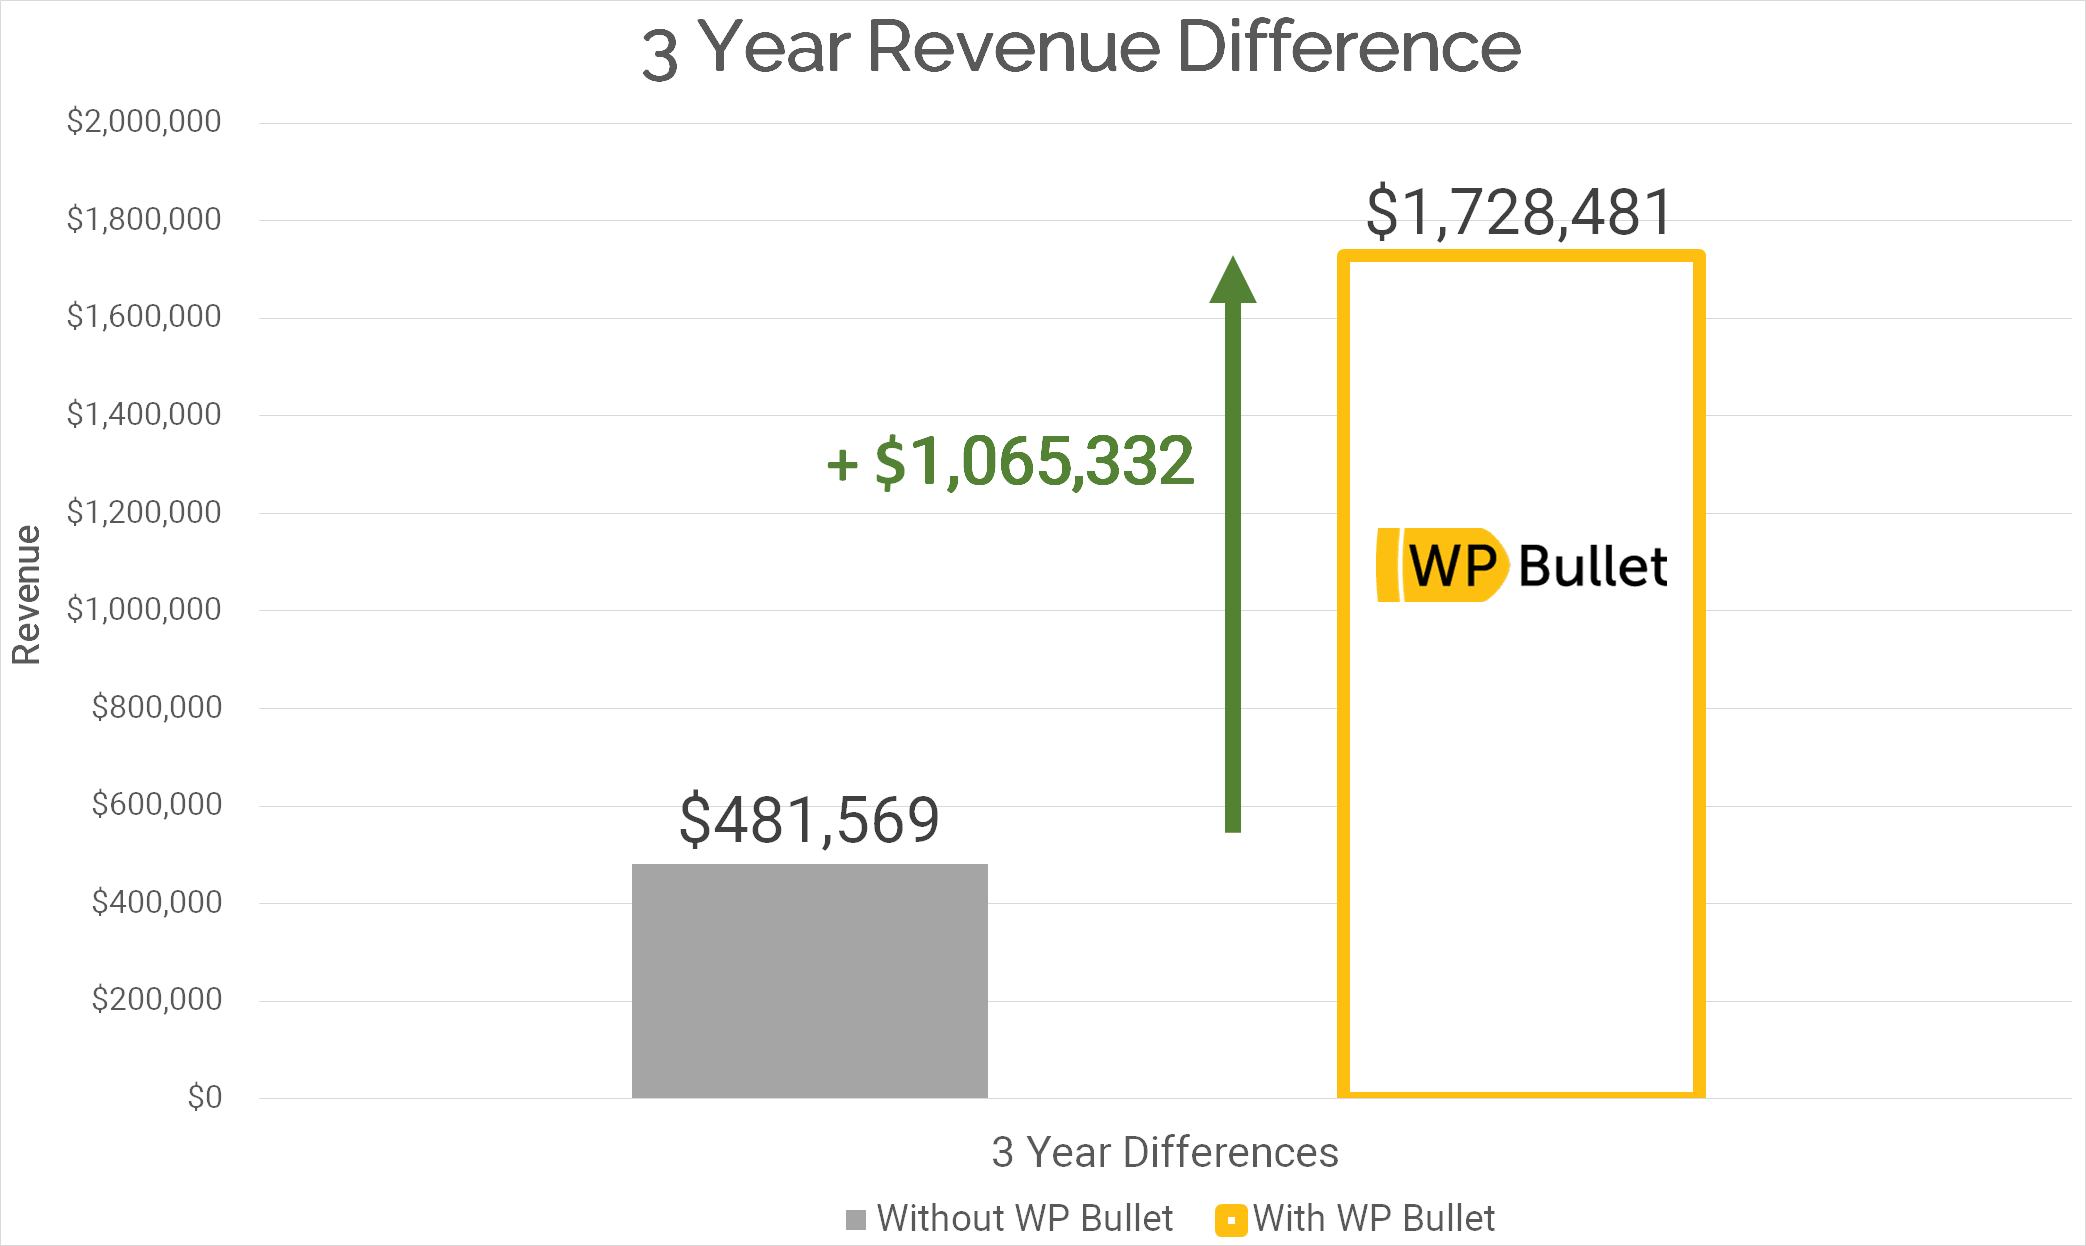
Based on this data, we can calculate how much the store would have made over the last 3 years if the optimizations were never completed.
If the site had stayed slow since 2017 then the revenue until June 2020 would have been $481,569.
Thanks to the optimizations, overall revenue since 2017 is $1.7 million.
The optimizations have therefore brought in over $1 million extra revenue which would not have been possible otherwise!
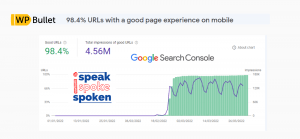
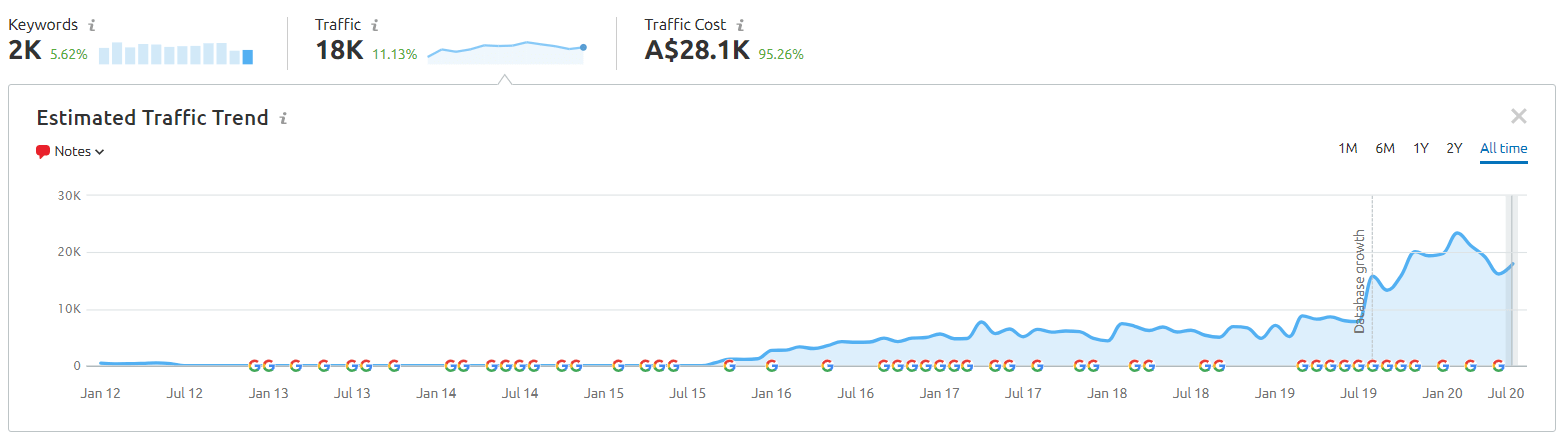
SEMRush shows a beautiful picture of how the site’s organic traffic was reinvigorated after the performance audit and tune-up.
This website ended up with all of these benefits after optimizing the site:
- Happier customers spending more money
- Happier and more productive employees
- Increased SEO rankings and new users
- Lower bounce rate
- Increased conversion rates
- Mobile users finally willing to stay, shop and spend
- Increased revenue by over $1 million Australian Dollars
- Ad investments finally paying off instead of crashing the site
If you are ready to take your store to the next level please reach out here.